UDP News
This Fall, the U District is Buzzing–The Ave Sees a 34% Uptick in Foot Traffic Since 2019!
December 4, 2024

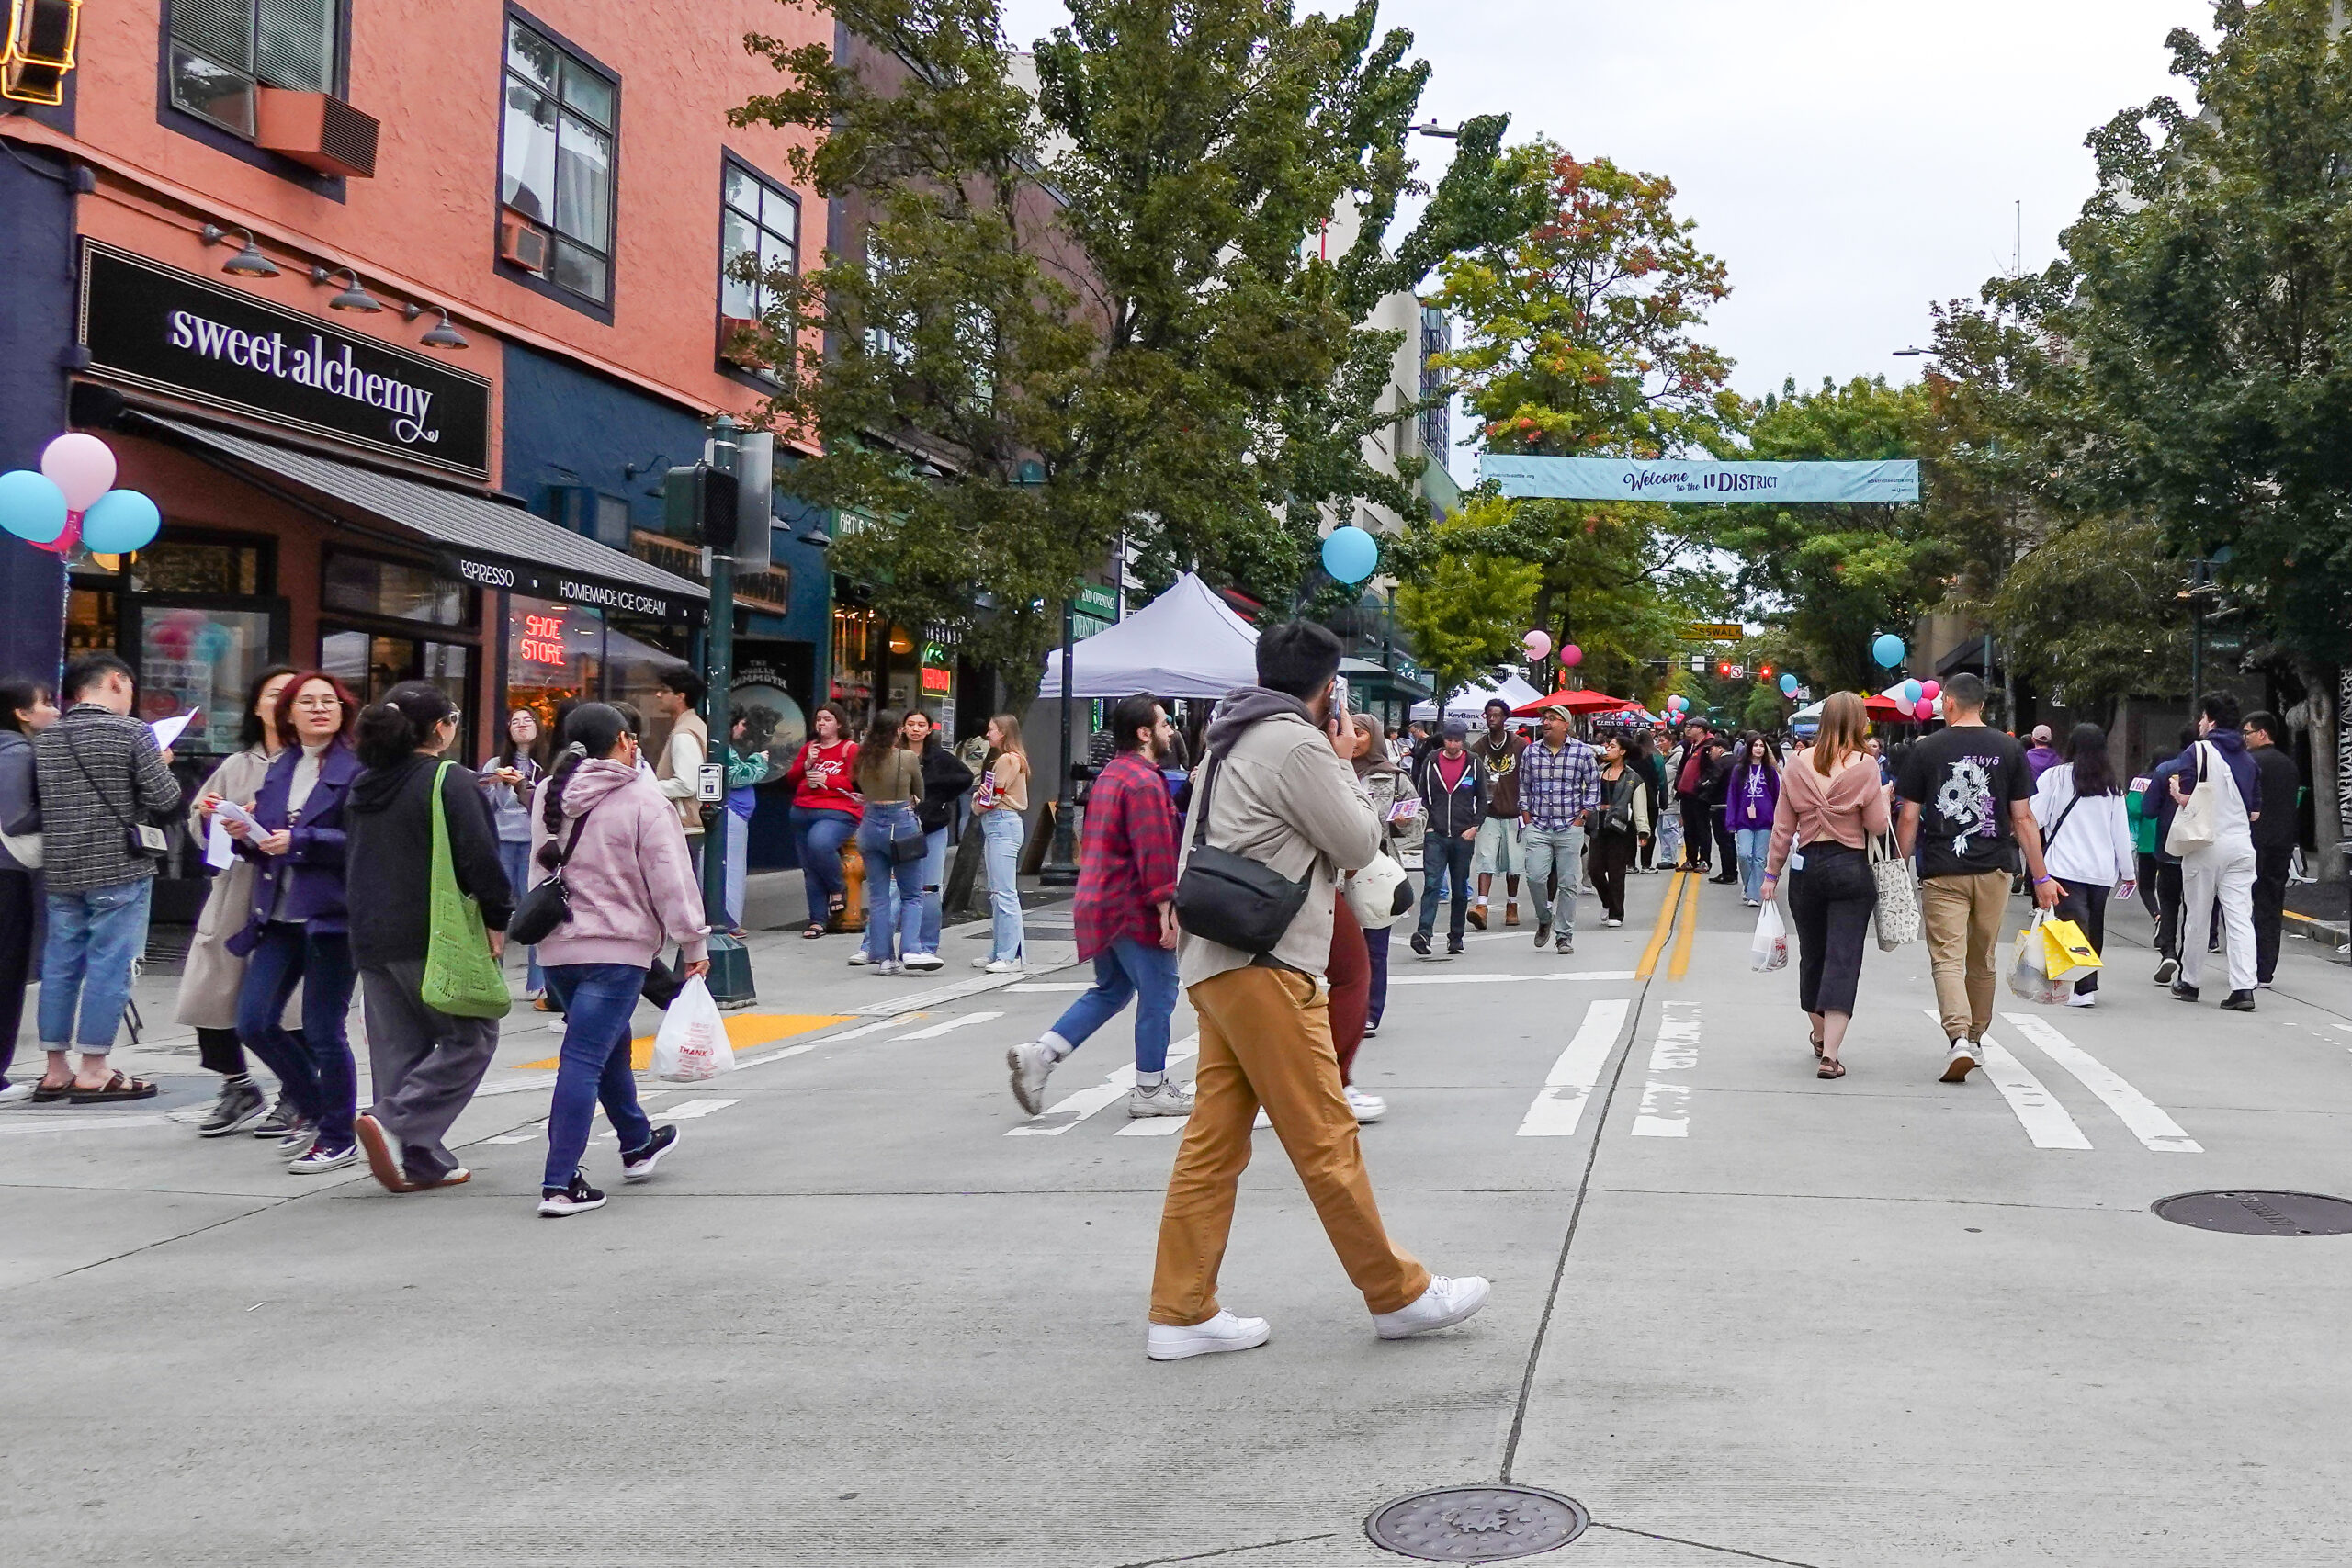
Over the last five years, the U District has seen a substantial growth in visitors and foot traffic. Naturally the first month of school represents an annual uptick in activity in the neighborhood. However, this year, this bump has been extraordinary. During the first month of the 2024-25 academic year, The Ave has seen a 34% increase in foot traffic over the same time period in 2019. It’s no wonder Seattle Magazine recently declared that “the U District is a stimulating change of scene,” in their latest article, The U District hums with energy.
Let’s dig into the numbers and see just how the neighborhood has become a renewed Seattle destination.
Activity by the Numbers – A Look at The Ave Comparing 2024 and 2019 (September 15-October 15)
With the help of the City of Seattle and Placer.ai, The U District Partnership conducted a report on pedestrian traffic during the first month of UW’s Fall Quarter against previous years. This is also how UDP calculates event attendance and commercial activity.
Looking at the U District’s core commercial area centered around The Ave, the first month of the school year saw a nearly 34% increase in 2024 for both unique visitors and total visit counts when compared to 2019 data. This represents an increase of approximately 97k more people visiting the core commercial area during the first month of school and about 290k more total visits to the Ave in 2024 than in 2019, before the pandemic.
A Bump in Visitors to the U District:
Expanding the map, back in 2019, the greater U District neighborhood* saw around 3.8 million visits between September 15-October 15 (capturing visitors, employees, and residents). Fast forward to 2024, and that number has skyrocketed to 4.9 million visits. That’s over 1 million additional visits during the first month of the 2024-25 academic year, showing the U District has come roaring back from notable pandemic dips in foot traffic during this same month-long time span in previous years.
Some reasons for these increases from pre-pandemic numbers may include expanded light rail access with the U District positioned as a major transit hub, an increase in residential buildings with 19 towers going live since 2019, an increase in UW’s student population (50,097 students as of 2024, compared to 47,572 in 2019), the launch of major festivals like the U District Chow Down along with enhanced neighborhood nightlife, and the draw of great businesses across the neighborhood attracting visitors from the greater Seattle region.
This growth speaks volumes about the U District’s vibrancy and growth over the past five years. From new eateries and fun events to enhanced spaces for gathering, the U District is becoming Seattle’s go-to neighborhood for locals and tourists alike.
Keep coming back, Seattle–there is always something new around the corner!
*Note: for the sake of this data, the greater U District boundary does not include Husky Stadium, but does include the area south of Ravenna Blvd, north of the Ship Canal, east of Interstate 5, and west of 25th Ave NE. The core commercial zone reflects a drawn boundary along University Way NE (or The Ave) from Campus Pkwy to NE 50th Street.
Data Sources:
- Placer.ai
- UW Student Count, https://www.washington.edu/opb/uw-data/fast-facts/fast-facts-html-only/
- 2019-2020 Enrollment Summary, https://cdn.doem.washington.edu/em/pdf/EM_AR-2019-20.pdf